Integrating Image Analysis and Dental Radiography for Periodontal and Peri-Implant Diagnosis
 Amarpreet Sabharwal1†
  Neil Kavthekar2†
  Jeffrey Miecznikowski3
  Michael Glogauer4
  Abhiram Maddi5*
  Pinaki Sarder6
- 1Dentistry, Schulich School of Medicine and Dentistry, Western University, London, ON, Canada
- 2Biomedical Engineering, University at Buffalo, New York, NY, United States
- 3Biostatistics, School of Public Health and Health Professions, University at Buffalo, New York, NY, United States
- 4Dentistry, University of Toronto, Toronto, ON, Canada
- 5Division of Periodontics, Department of Stomatology, Medical University of South Carolina (MUSC), Charleston, SC, United States
- 6Pathology and Anatomical Sciences, University at Buffalo, New York, NY, United States
The recent change in classification of periodontal and peri-implant diseases includes objective evaluation of intra-oral radiographs and quantification of bone loss for disease staging and grading. Assessment of the progression of periodontal disease requires deduction of bone loss longitudinally, and its interpretation as (1) a percentage in relation to tooth root and (2) as a function of the patient's age. Similarly, bone loss around dental implants, after accounting for initial remodeling, is central for determining diagnosis, severity, and progression of peri-implantitis. Bone gain secondary to periodontal regeneration can be measured using standardized dental radiographs and compared to baseline morphology to determine treatment success. Computational image analysis, including machine learning (ML), has the potential to develop and automate quantitative measures of tooth, implant, bone volumes, and predict disease progression. The developed algorithms need to be standardized while considering pre-analytic, analytic, and post-analytic factors for successful translation to clinic. This review will introduce image analysis and machine learning in the context of dental radiography, and expand on the potential for integration of image analysis for assisted diagnosis of periodontitis and peri-implantitis.
Computational Image Analysis in Biomedicine and Healthcare
Image quantification approaches in biomedicine and healthcare can be broadly categorized into: classical image analysis (1), applied classical machine learning (ML) (2), and deep learning (DL) (3). These analyses are becoming increasingly applicable in the field of computer vision due to the advent of modern imaging technologies and increased volumes of data. In dentistry, acquisition of intraoral radiographs for screening and as part of problem-focused examinations is standard of care, thus providing longitudinal data points that are excellent inputs for computer vision applications and can assist the clinician in both diagnosis and prediction.
Classical image analysis approaches include intensity transformation, binarization, segmentation, morphological processing, and quantification [see example in (4)]. A pipeline resulting from utilization of classical image analysis approaches can process an input image such as a dental radiograph through a multi-step process to extract and quantify information of interest. ML is a branch of artificial intelligence (AI) that provides systems and programs with the ability to learn and improve automatically to make better decisions based on the provided input (2). Classical ML includes methods such as logistic regression, support vector machines (SVMs), or naïve Bayesian classification (2). Various classification tasks, including detection of patterns within an image can be performed with ML.
DL methods are based on artificial neural networks (ANN) that use non-linear transmission of information from an input image through a series of layers modeled as a network for conducting a classification task (5). A popular DL method for image analysis is a convolutional neural network (CNN) (1). CNNs employ convolution in at least one of the network layers to filter complex feature information at some spatial location of the input image (6). For example, a CNN can use lower layers to identify edge information in an image, while using the middle layers to identify more complex features, and the highest layers to learn features that the human visual cortex uses to identify objects via information mined from an object (7). Due to DL's ability to detect features and use them to perform complex tasks in image analysis, they have become prevalent in the medical imaging community. In dentistry, image analysis has been successfully used on cephalometric, panoramic, intraoral, and CBCT projections for detection of anatomical landmarks and dental and skeletal pathologies, such as periodontitis, dental caries, odontogenic cysts and tumors, and osteoporosis (8). The rapidly evolving landscape around image analysis using ML models and demonstration of their utilization in assessment of morphological characteristics on dental radiographs extends the scope of clinical tools available to a modern-day practicing dentist. Further, image annotation will help standardize radiology reporting to clinicians as annotated images can be linked to radiographic findings in structured radiology reports. Annotated images and structured radiology reports can also serve as important communication and education tools for the patient and present relevant findings with clarity (9, 10).
Dental Radiography and Diagnosis of Periodontitis and Peri-Implantitis
Periodontitis and peri-implantitis are clinical-radiographic diagnosis of inflammatory conditions that result from loss of supporting tissues around teeth and dental implants, respectively (11). Inherent to the case definitions for diagnoses of periodontitis and peri-implantitis is a requirement for measurement of loss of supporting tissues, and their comparison to previously obtained measurements for assessment of history of disease activity, severity, and progression (12). Therefore, radiographic evaluation of supporting bone around dental implants and teeth have found a pivotal role in the revised classification for periodontal and peri-implant diseases and conditions (11).
In the recent classification of periodontal and peri-implant diseases and conditions, periodontitis is qualified into stages and grades. Staging of periodontitis entails determination of disease severity, complexity, and extent. Likewise, grading of periodontitis includes determination of disease progression and specific risk factors (12). Both, determination of disease severity and progression requires evaluation of intraoral radiographic data. Specific radiographic criteria for staging and grading are presented in Table 1.
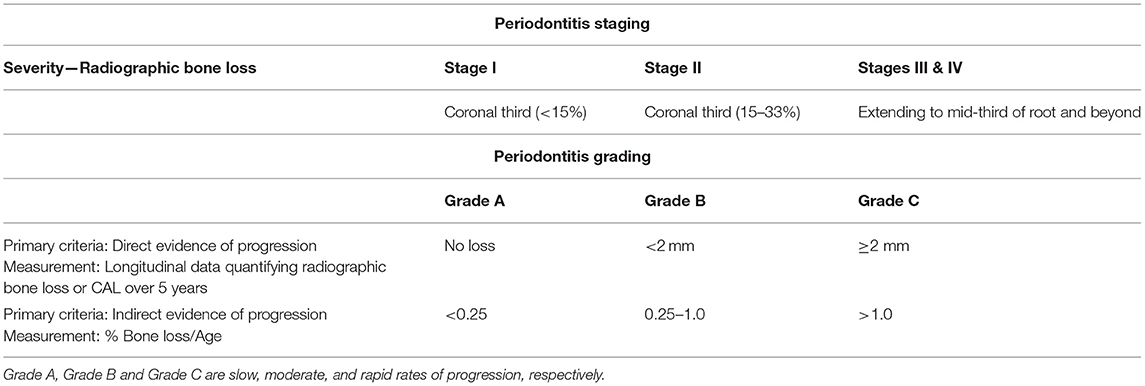
Table 1. Radiographic parameters for determination of periodontitis stage and grade.
Introduction of interdental clinical attachment loss (CAL) at the site of greatest loss is a crucial development in the recent classification system that allows for incorporation of intra-oral radiography in periodontal staging (12). Assessment of interdental bone levels can be achieved reliably and reproducibly as the radiographic details in intraoral radiographs are not obfuscated by the radiopacity from underlying root structure. Furthermore, proximity of interdental bone levels to dental anatomic structures that are usually not altered by periodontal disease activity, such as tooth root and cemento-enamel junction (CEJ) renders calculation of interdental bone loss as a function of tooth root length. Furthermore, changes in interdental bone height from levels of CEJs of adjacent teeth serve as an objective and reproducible measurement of interdental bone loss in periodontitis.
Like periodontitis, radiographic determinants of peri-implantitis include objective radiographic criteria. These radiographic determinants include, (a) progressive bone loss in relation to peri-implant radiographic bone levels at 1 year following the delivery of implant-supported prosthesis, and (b) peri-implant radiographic bone loss ≥3 mm coupled with peri-implant probing depth of ≥6 mm and bleeding on probing (13).
Intra-oral radiographs are particularly suited as input for development of quantitative diagnostic and predictive machine learning algorithms as radiographic images are obtained sequentially during the lifespan of a patient's dental treatments. While radiographic images are less susceptible to introduction of human error when compared to clinical data entries, quality of an intra-oral radiographic image can vary based on operator technique at image acquisition. Such errors can be minimized by introduction of orientation adjuncts for intraoral radiography, to provide standardized and reproducible radiographs (14). Standardized intra-oral radiographs and their integration with image analysis algorithms will allow for objective and automated measurements of periodontal and peri-implant bone loss and treatment outcomes such as bone gain secondary to regenerative periodontal procedures.
Morphological Characteristics and Anatomical Landmarks on Intraoral Radiographs
Intraoral radiographs are representations of dental anatomic structures which present with varying degrees of radiopacity and radiolucency. Additionally, the shape, texture and relationship between dental anatomic structures provide a rich repertoire of images for downstream computational evaluation. Gross anatomical landmarks of interest in intraoral radiographs obtained to evaluate periodontitis and peri-implantitis include teeth and their root(s), implants, and alveolar bone. Additionally, bone loss as a function of root/implant length is of interest and requires determination of anatomic root length (CEJ to root apex) and implant length (12, 13). Radiographic presentation of alveolar bone loss is variable but the contextual representation of bone loss as a function of root/implant length provides a relatively stable reference length. The levels of CEJs on adjacent teeth and their consistent relationship to interdental bone levels along with the outlines of tooth root(s) and dental implants offers a reproducible frame of reference for our region of interest, i.e., interdental bone loss in periodontitis and peri-implantitis (Figures 1A,B). When sequential radiographs are not available to determine longitudinal loss of interdental bone, these radiographic landmarks are crucial. Conversely, when CEJs are obfuscated by dental restorative treatment, pre-treatment radiographs are important for determination of CEJ position. For dental implants, an assumption of good clinical practice and standard of care is inherent when baseline radiographs are not available. There are two clinical problems that computational methods in image analysis can potentially address: (a) detection and quantification of bone loss in periodontitis and peri-implantitis, and (b) prediction of disease progression. Below, we will elaborate on the principles of radiographic image analysis in the context of alveolar bone loss in periodontitis and peri-implantitis.
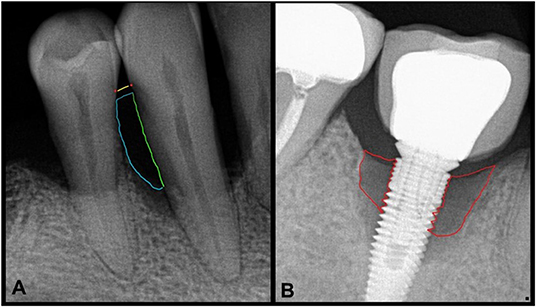
Figure 1. Intraoral radiographs with periodontitis (A) and peri-implantitis (B). (A) The area of interest to assess bone loss secondary to periodontitis shows a yellow line at the level of CEJs (red dots) of adjacent teeth. The green line depicts the tooth root as a boundary of the region of interest which along with the blue curved line shows the approximate and representative area of complete bone loss. (B) Similarly, areas of most severe peri-implant bone loss are shown by the red boundary.
Computational Image Analysis in Dental Radiography
We discuss herein a generic pipeline for integration of image analysis tools and dental radiography in the clinical context of periodontitis and peri-implantitis. Steps in this pipeline potentially involve classical image analysis operations, such as reading raw image data by computer, performing an intensity transform, binarization, morphological post-processing, segmentation, and then applying a ML or DL model. Classical image analysis operations can be used to construct an independent analytic pipeline without the use of ML or DL. Conversely, DL or CNN can be applied directly to an input image. Below, we discuss classical image analysis in relation to dental radiography and introduce core concepts in this regard.
After reading raw image data by computer, intensity transformations are applied for image contrast enhancement. A common intensity transformation operation is conversion of red-green-blue (RGB) to grayscale color space. This intensity transformation has been used to distinguish between the cortical and cancellous bone in dental radiographs (15). The computational assessment of cancellous bone architecture and relationship between cortical and cancellous bone may serve as predictors for treatment success (15, 16). Another form of intensity transformation called histogram equalization (17) can be used to improve low contrast regions and convert uneven intensity distribution in an image to a uniform distribution (18). Histogram equalization works well if the entire image has a similar dynamic range of intensities. However, like in other medical imaging applications, in intraoral dental radiographs, the dynamic range of intensity distribution is expected to have wide and uneven pixel intensities and contrasts resulting from anatomical landmarks, dental diseases and their treatments. Therefore, regular histogram equalization may not enhance the radiograph images adequately and contrast limited adaptive histogram equalization (CLAHE) is recommended (1). CLAHE limits over amplification of contrast by limiting the operation on small regions of the image. Further, different types of filtering operations can be conducted pre- or post-CLAHE, such as using Gaussian high pass filter for sharpening the image, noise adjustment, and edge and ridge detection (19–21).
After applying intensity transformation of choice, next step involves thresholding the image for preliminary segmentation. This process results in a binary image, where the grayscale (multi tone) image is converted to binary image (with pixels as “0” or “1”) and is aptly called binarization. Pixels in the foreground can be white or black and the pixels in the background are opposite of foreground pixels (22). Binarization is popular across many imaging domains for pertinent processing of image data, such as augmented reality, photography, and microscopy and radiographic imaging (23). Thresholding of image intensity which is used for binarization can be fixed or adaptive. In fixed value thresholding, the intensity value of each pixel is compared against a user-defined value for binarization (24). Adaptive thresholding methods, such as Otsu's thresholding and entropy based thresholding, have been used in image analysis of dental radiographs and involve different histogram thresholding for both local and global binarization (25–27). These methods employ the variance of the pixel intensity values to compute the optimal threshold as opposed to a fixed value (28) and have been used in computational assessment of bone loss around dental implants and teeth (25–27).
Binary image obtained from thresholding operations is subjected to morphological post-processing. While there are many morphological operations, two foundational operations are erosion and dilation (29). The erosion operation takes two inputs: binary or grayscale image and a structural kernel. The kernel defines the transformation of the binary image such as reducing the size of the foreground object, increasing the size of the background and removing selected detail. For example, erosion can be used to locate the sharp boundary of the dental anatomical structures (27). Another common morphometric operation is dilation. Dilation conducts exactly the opposite operation of erosion. Namely, as the dilation kernel moves around the image, it increases the size of the foreground structure, and decreases the size of the background. This method can be used to identify all regions that contain teeth in an image (30). Morphological post-processing operations can be built by combining foundational operations of erosion and dilation. In morphological closing, erosion follows dilation and it has been used to detect teeth (31) and close small holes in the foreground area, such as space between teeth (24, 32). Conversely, morphological opening consists of erosion and then dilation which is useful for removing noise from an image (33).
Statistical and Analytical Considerations
Benchmarking techniques to evaluate diagnostic instruments is a well-studied problem in the statistical community (34). In our setting, the diagnosis is with respect to periodontal and peri-implant diseases and the diagnostic instruments may be machine learning derived classifications from intraoral radiographs or other imaging modalities. The general techniques to compare these classifications will depend on the availability of ground-truth or a gold-standard. Ground-truth here refers to a classification that is perfect while a gold-standard refers to a classification that has a “reputation in the field” as a reliable call (35). A gold-standard may not be a perfect test (as ground-truth) but merely the best available test that has a standard with known results. When a gold-standard or ground-truth is available, the utility of diagnostic instruments can be assessed with a series of statistical quantities. Initially, point estimates of sensitivity and specificity together with estimates of their variability (e.g., 95% confidence intervals) can be obtained using maximum likelihood theory (34). Sensitivity in this context is the probability that a subject having the disease (assessed by, say, the gold-standard) is also classified by the proposed diagnostic instrument as having the disease. Analogously specificity is the probability that a subject without the disease is classified by the instrument as not having the disease. Consequently, an instrument with low sensitivity will have a high false negative rate, i.e., a high probability that diseased subjects will (erroneously) test negative for the disease. Similarly, an instrument with low specificity will have a high false positive rate, i.e., a high probability that non-diseased subjects will (erroneously) test positive for the disease. Chi-squared tests can be performed to compare competing diagnostic measures for equality of their sensitivity and specificity values. These measurements of specificity and sensitivity can be viewed as benchmarking the analytical validity of the diagnostic instrument (36). That is, the ability of the instrument to characterize or measure the information in the images or radiographs.
After analytical validity has been established, the next step is clinical utility. In clinical utility, we assess the diagnostic instrument's ability to detect periodontal disease. The statistical quantities to address this question are positive predictive value and negative predictive value. Positive predictive value (PPV) is the probability of truly having the disease given the subject was determined (or classified) as having the disease according to the instrument. Negative predictive value (NPV) is the probability of truly not having the disease given the subject was classified by the instrument as being disease free. PPV, NPV, and, ultimately, overall accuracy are closely related to sensitivity and specificity but also consider the prevalence of the disease. The well-known Bayes' theorem connects PPV, NPV, sensitivity, specificity, and prevalence. Prevalence of the disease refers to the frequency of, say, periodontal disease in the population under study. For example, if we estimate 10% of the population with dental implants has peri-implantitis, then a diagnostic instrument with 90% sensitivity and 90% specificity has a positive predictive value of 50%. If the maintenance of treated peri-implantitis cases is, say, quarterly rather than biannual dental visits, a PPV of 50% suggests that the prescribed quarterly dental visits was unnecessary for one out of every two subjects diagnosed with peri-implantitis.
Reverse engineering the progression of analytical to clinical validity may be a reasonable approach when calibrating or designing a future diagnostic instrument. That is, with an estimate of prevalence and an appreciation for the cost involved in a faulty diagnosis, researchers can often set desirable or acceptable PPV and NPV values and then work backwards to calculate the target sensitivity and specificity for their instrument to obtain the desired PPV and NPV values.
The previous paradigm for benchmarking a diagnostic instrument is reasonable in the presence of ground truth or a gold standard. However, with some periodontal diseases such as those associated with systemic diseases and certain genetic mechanisms, these quantities may not exist. In that context, there may be several potential diagnostic instruments but no clear gold standard or ground truth. In this case, researchers are often forced to abandon the accuracy question and must settle for merely comparing the frequency of (dis)agreements on the diagnostic instruments obtained from an identical set of data. Statistical tools designed for these analyses fall under the umbrella of inter-rater reliability which assesses the degree of agreement among different (independent) instruments designed to classify periodontal diseases. While there is a large number of statistics designed to address inter-rater reliability (37), in the context of diagnosis a well-used statistic is Cohen's kappa coefficient (38). Cohen's kappa coefficient is designed as a robust measure of agreement percentage that also considers the agreement occurring by chance. If the diagnostic instruments are in complete agreement, then kappa equals 1, if there is no agreement other than what would be expected by chance kappa equals 0 and if the agreement is worse than random then kappa is negative. Akin to estimating the variability of sensitivity and specificity estimates, similar techniques also exist to estimate the variability (e.g., confidence intervals) for kappa estimates.
Standardization of dental radiographs before implementing image analysis and ML algorithms is important to avoid noise-in noise-out situations. Largely, pre-analytic factors to consider for standardization in dental radiography originate from inherent image characteristics and variation during image acquisition. Inherent image characteristics would include variables such as brightness, contrast, resolution, and pixel size. Brightness and contrast enhancements can impact diagnostic accuracy of the evaluator (39). While there is no consensus on optimal image characteristics and exposure conditions required for detection of pathologies in image analysis models, recent studies have demonstrated methods to standardize dental radiographs in accordance with international guidelines (40, 41). These studies evaluated the effect of beam quality and pixel size using modulation transfer function (MTF) and normalized noise power spectrum (NNPS) in accordance with International Electrotechnical Commission (IEC) standards. Further, image analysis models that systematically detect image acquisition errors in intraoral radiography (42) can improve quality control. Some of these errors result from operator technique and patient positioning (43). These errors can result in distortion of anatomic landmarks but are well-known and easily recognized. However, minor variations in anatomical landmarks that can have an impact on quantitation and prediction of disease progression should either be systematically eliminated by using radiograph positioning adjuncts (14) or anchoring dental radiographs to their respective geometric ground truth.
Further, dental radiographic image analysis performance relies on analytic factors pertaining to processing, such as the model, model parameters as well as initialization used for model optimization. Often different models, or models implemented using different libraries (tensorflow, pytorch, etc.) offer different results, requiring further standardization of models and developing ontology for sharing and benchmarking computational models and downstream provenance. Post-analytic factors include the derived features or results after image analysis is conducted. Standardization of the resulting metrics will allow seamless comparison of the results generated via different computational models or based on datasets from different institutions or modalities. Two recent works on quantitative image ontology can be consulted for further discussion on pre-analytic, post-analytic, and analytic factors pertaining to medical image analysis and standardization (44, 45).
Evidence and Current Literature
Above, we introduced classic image analysis methods and their application in dental radiography. We discuss below recent and relevant literature that studies application of image analysis to dental radiographs with periodontitis and peri-implantitis. A summary of this literature is tabulated in Table 2.
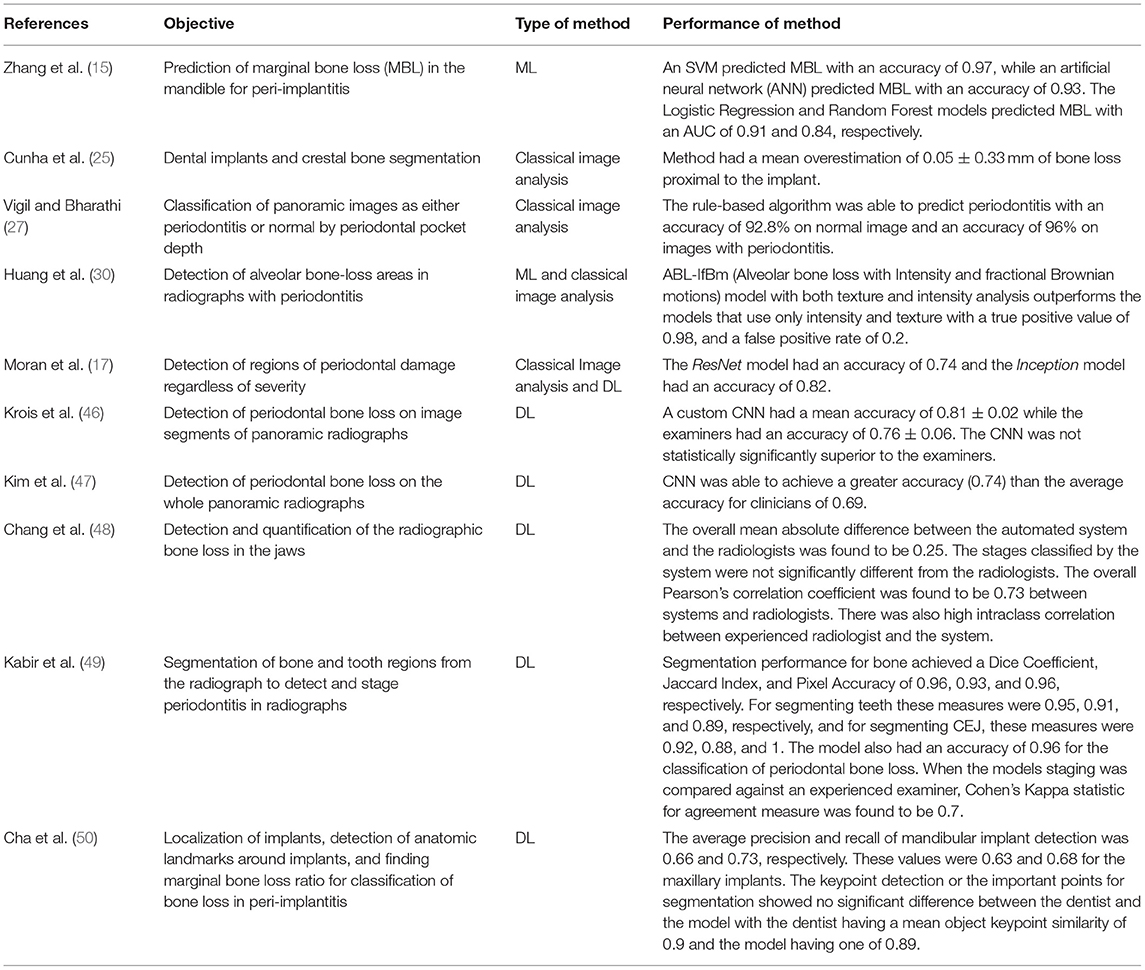
Table 2. Summary of recent literature that employed computational image analysis methods on dental radiographs for periodontitis and peri-implantitis.
Classical CNNs have been used to detect interproximal regions for the presence of periodontal bone destruction in periapical radiographs and have demonstrated testing accuracy of 0.74 (ResNet model) and 0.82 (Inception model), respectively. While intra-oral radiography is standard of care for detection and treatment planning for periodontitis and peri-implantitis, some authors have explored panoramic dental radiographs for this purpose and achieved promising results with ML techniques (17). Krois et al. (46) implemented a custom CNN to detect periodontitis on panoramic dental radiographs. While the resulting CNN did not offer statistically superior performance when compared to experts, authors concluded that their method can still be used to ease clinician's burden. Using this work as a basis, a custom deep CNN was implemented to detect periodontal bone loss in panoramic dental radiographs (47). In this study, the authors employed a deeper CNN on an over 100 times larger dataset of panoramic radiographs, and expected better performance than that achieved by Krois et al. (46). By using transfer learning and prior clinical knowledge, this deeper CNN was able to detect periodontal bone loss. The accuracy in detecting periodontal bone loss was found to be 0.75 on the test set while the average accuracy of the clinicians was 0.69 (47), demonstrating performance improvement that CNNs can offer for detection of periodontal bone loss in panoramic dental radiographs.
Information obtained from image analysis of dental radiographs can contribute to improved computer aided diagnosis (CAD). Chang et al. (48) developed a DL hybrid method to automatically detect periodontal bone loss and stage periodontitis. A CNN model was used to detect periodontal bone loss on an individual tooth basis in a dental panoramic radiograph and the CAD portion of the pipeline was used to classify the amount of periodontal bone loss and stage it according to the criteria developed in 2017 World Workshop on the Classification of Periodontal and Peri-Implant Diseases and Conditions (51). CADs could be particularly helpful when there is a moderate level of inter-examiner consistency (52). Chang et al. (48) showed that their CNN model was able to detect periodontal bone levels in panoramic radiographs with performance metrics of 0.92 (Jaccard Index), 0.93 (pixel accuracy), and 0.88 (dice coefficient values). CEJ levels, and teeth and implant structures were also detected with high accuracy. Further, the difference between periodontal staging between the experts (senior radiologist, fellow, resident) and the CNN was measured using a mean absolute difference (MAD) calculation, and the overall MAD between radiologists and the automated pipeline was 0.25. While this study compared performance between an experienced oral radiologist, oral radiology trainees, and a CNN model, it should be noted that these differences may be different in a clinical practice where dentists who are not trained in oral radiology, but experts in their respective fields will evaluate dental radiographs for diagnosis and treatment needs (52).Chang et al. (48) also found that the automatic method was not significantly different from the radiologist's diagnosis of periodontitis in the maxilla and mandible, nor was it different when taking the whole jaw into account. The correlation of diagnosis between the automated method and experienced radiologist was highest with a value of 0.76 (Pearson correlation) and 0.86 (Intraclass correlation). This study showed a strong correlation between human evaluators and the automated method with an overall Pearson correlation of 0.73 and an overall intraclass correlation of 0.91. The highest intraclass correlation of 0.86 was noted between the automated method and most experienced human evaluator. In summary, this study demonstrated dental radiographic image analysis for detection of periodontitis can be achieved at the level of an experienced professional, and this information can be successfully integrated in a CAD workflow. Similarly, Kabir et al. (49) have shown that end-to-end CNNs (53) are able to classify the amount of bone destruction in a periodontitis periapical radiograph with a classification accuracy of 0.96. Studies mentioned above demonstrate the potential of integrating ML models and image analysis to detection and diagnosis of periodontitis.
Like periodontitis, use of DL and image analysis for detection and diagnosis of peri-implantitis is developing. Recently, a CNN model was used for detection and segmentation of bone, implant, and teeth in periapical radiographs with peri-implantitis (50). In this study, a deep CNN model was able to measure bone resorption severity and bone loss percentage around dental implants and the assessments provided by this CNN model and clinicians were not found to be statistically significantly different. Zhang et al. (15) used support vector machines, logistic regression, artificial neural networks, and random forest models to predict marginal bone loss more accurately than conventional statistical methods that describe the trabecular bone structure such as the structural model index or the trabecular bone pattern. Using the quantifying metrics from the processed images, this work correlates marginal bone loss as well as percent bone volumes with smoking status, to understand the impact of other covariates on severe bone loss as well as if the quantified image metrics can predict marginal bone loss. Future studies will benefit from contextualizing the image analysis operations with clinical information and correlating digital and clinical markers for risk prediction.
Summary and Conclusions
Modern advent in medical imaging and parallel progress in computer hardware and progress in machine learning model optimization have empowered us to use AI/ML in solving important healthcare problems. Application of AI/ML in the context of quantification of dental radiography and, ultimately, the development of diagnostic tools for clinicians are emerging problems in the literature.
Computationally assisted diagnosis and prognosis will become part of standard dental practice in the near future. In this review, we discussed the impact of computational image analysis on one clinical problem in dentistry. With further and rapid development in computational image analysis for dental radiography, it is important to benchmark the performance of the developed methods under a common framework. Thorough benchmarking of image analysis algorithms will help these methods to be eventually used in the clinic. The major barriers in this regard are image data variability from one institute to another, bias in training set, often varying conventions or types of computational models used for development and sharing results without following specific standards. All these aspects are further amplified by varying levels of agreement in diagnostic criteria by one clinician to another, and variation in ground-truth annotations or labels. This gap in the literature is also applicable to dental radiography, and requires careful standardization of data, computational model, and results disbursed from the computational models.
Further, toward the goal of potential clinical translation, once the community is well-equipped with standardization methods for summarizing data as well as computational models, it will be important to benchmark the performance of newly developed models under a set of standards. This direction requires availability of a large, standardized database of dental radiographs with appropriate quality control and quality assurance in place as well as ground-truth of pertinent structures annotated by senior experts. Developing such a database will standardize dental radiography image data analysis for the benefit of our patients and clinicians alike.
To conclude, dental radiography image analysis using AI/ML tools is an emerging area. This review sheds light along this direction using periodontitis and peri-implantitis as vehicles. The review discusses challenges involved in morphometric assessment while discussing associated morphometry for clinical assessment and addressing the use of classical image analysis tools to tackle the associated radiographic images. Lastly the review provides a discussion of the methods to evaluate the statistical performance of resulting algorithms and an overview of the current literature utilizing AI/ML tools in dental radiography image analysis. We further discuss the need of data and model standardization as well as availability of large, standardized database for downstream provenance and benchmarking of the developed tools for eventual clinical translation.
Author Contributions
AS and NK contributed to the conceptual design, literature review, and writing of the manuscript. MG, JM, AM, and PS contributed to the conceptual design and writing and editing of the manuscript. All authors contributed to the article and approved the submitted version.
Funding
The work was supported by a faculty start-up funding (PS) provided by the Jacobs School at University at Buffalo to PS.
Conflict of Interest
The authors declare that the research was conducted in the absence of any commercial or financial relationships that could be construed as a potential conflict of interest.
Publisher's Note
All claims expressed in this article are solely those of the authors and do not necessarily represent those of their affiliated organizations, or those of the publisher, the editors and the reviewers. Any product that may be evaluated in this article, or claim that may be made by its manufacturer, is not guaranteed or endorsed by the publisher.
References
1. Gonzalez RC, Woods RE. Digital Image Processing, 3rd Edn. Upper Saddle River: Prentice-Hall, Inc. (2006).
2. Hastie T, Tibshirani R, Friedman J. The Elements of Statistical Learnin. New York: Springer. Cited on: 33 (2009). doi: 10.1007/978-0-387-84858-7
3. Altaf F, Islam SM, Akhtar N, Janjua KN. Going deep in medical image analysis: concepts, methods, challenges, and future directions. IEEE Access. (2019) 7, 99540–72. doi: 10.1109/ACCESS.2019.2929365
4. Ginley BG, Emmons T, Lutnick B, Urban CF, Segal BH, Sarder P. Computational detection and quantification of human and mouse neutrophil extracellular traps in flow cytometry and confocal microscopy. Sci. Rep. (2017) 7:17755. doi: 10.1038/s41598-017-18099-y
5. Chan HP, Samala RK, Hadjiiski LM, Zhou C. Deep learning in medical image analysis. Deep Learning in Medical Image Analysis. (2020). p. 3–21. doi: 10.1007/978-3-030-33128-3_1
8. Hung K, Montalvao C, Tanaka R, Kawai T, Bornstein M. M. The use and performance of artificial intelligence applications in dental and maxillofacial radiology: a systematic review. Dentomaxillofacial Radiol. (2020) 49:20190107. doi: 10.1259/dmfr.20190107
9. Dunnick NR, Langlotz CP. The radiology report of the future: a summary of the 2007 intersociety conference. J. Am. College Radiol. (2008) 5:626–9. doi: 10.1016/j.jacr.2007.12.015
10. Kahn CE Jr, Langlotz CP, Burnside ES, Carrino JA, Channin DS, Hovsepian DM, et al. Toward best practices in radiology reporting. Radiology. (2009) 252:852–6. doi: 10.1148/radiol.2523081992
11. Caton JG, Armitage G, Berglundh T, Chapple IL, Jepsen S, Kornman KS, et al. A new classification scheme for periodontal and peri-implant diseases and conditions–Introduction and key changes from the 1999 classification. Wiley Online Library. (2018) 89: S1–8. doi: 10.1002/JPER.18-0157
12. Tonetti MS, Greenwell H, Kornman S. K. Staging and grading of periodontitis: framework and proposal of a new classification and case definition. J. Periodontol. (2018) 89:S159–72. doi: 10.1002/JPER.18-0006
13. Schwarz F, Derks J, Monje A, Wang LH. Peri-implantitis. J. Clin. Periodontol. (2018) 45:S246–66. doi: 10.1111/jcpe.12954
14. Liu M, Wang S, Chen H, Liu Y. A technique to fabricate a custom CAD-CAM periapical radiographic film holder for implant assessment. J. Prosthetic Dentistry. (2021). doi: 10.1016/j.prosdent.2021.05.016 [Epub ahead of print].
15. Zhang H, Shan J, Zhang P, Chen X, Jiang H. Trabeculae microstructure parameters serve as effective predictors for marginal bone loss of dental implant in the mandible. Sci. Rep. (2020) 10. doi: 10.1038/s41598-020-75563-y
16. Simons WF, De Smit M, Duyck J, Coucke W, Quirynen M. The proportion of cancellous bone as predictive factor for early marginal bone loss around implants in the posterior part of the mandible. Clinical Oral Implants Res. (2015) 26:1051–9. doi: 10.1111/clr.12398
17. Moran MBH, Faria M, Giraldi G, Bastos L, da Silva Inacio B, Conci A. “On using convolutional neural networks to classify periodontal bone destruction in periapical radiographs,” in 2020 IEEE International Conference on Bioinformatics and Biomedicine (BIBM), IEEE. doi: 10.1109/BIBM49941.2020.9313501
19. Dogra A, Bhalla P. Image sharpening by gaussian and butterworth high pass filter. Biomed Pharmacol J. (2014) 7:707–13. doi: 10.13005/bpj/545
20. Li C-W, Lin S-Y, Chou H-S, Chen T-Y, Chen Y-A, Liu S-Y, et al. Detection of dental apical lesions using CNNs on periapical radiograph. Sensors. (2021) 21:7049. doi: 10.3390/s21217049
21. Mao Y-C, Chen T-Y, Chou H-S, Lin S-Y, Liu S-Y, Chen Y-A, et al. Caries and restoration detection using bitewing film based on transfer learning with CNNs. Sensors. (2021) 21:4613. doi: 10.3390/s21134613
22. Lai Y-K, Rosin PL. Efficient circular thresholding. IEEE Transact Image Proc. (2014) 23:992–1001. doi: 10.1109/TIP.2013.2297014
23. Bradley D, Roth G. Adaptive thresholding using the integral image. J. Graph. Tools. (2007) 12:13–21. doi: 10.1080/2151237X.2007.10129236
24. Rais NB, Hanif MS, Taj AI. “Adaptive thresholding technique for document image analysis,” in 8th International Multitopic Conference, 2004. Proceedings of INMIC. (2004). IEEE.
25. Cunha P, Guevara MA, Messias A, Rocha S, Reis R, Nicolau M. P. A method for segmentation of dental implants and crestal bone. Int. J. Computer Assisted Radiol. Surgery. (2013) 8:711–21. doi: 10.1007/s11548-012-0802-6
26. Lin P, Huang P, Huang P, Hsu H. Alveolar bone-loss area localization in periodontitis radiographs based on threshold segmentation with a hybrid feature fused of intensity and the H-value of fractional Brownian motion model. Computer Methods Programs Biomed. (2015) 121:117–26. doi: 10.1016/j.cmpb.2015.05.004
27. Vigil MA, Bharathi VS. Detection of periodontal bone loss in mandibular area from dental panoramic radiograph using image processing techniques. Concurrency Comput. (2021) 33:6323. doi: 10.1002/cpe.6323
28. Zhu N, Wang G, Yang G, Dai W. “A fast 2d otsu thresholding algorithm based on improved histogram,” in 2009 Chinese Conference on Pattern Recognition, Nanjing: IEEE (2009). doi: 10.1109/CCPR.2009.5344078
29. Ohki M, Zervakis ME, Venetsanopoulos NA. 3-D digital filters. Control Dynamic Syst. (1995) 69:49–88. doi: 10.1016/S0090-5267(05)80038-6
30. Huang PW, Huang PY, Lin PL, Hsu HC. “Alveolar bone-loss area detection in periodontitis radiographs using hybrid of intensity and texture analyzed based on FBM model,” in 2014 International Conference on Machine Learning and Cybernetics, Lanzhou: IEEE (2014). doi: 10.1109/ICMLC.2014.7009656
31. Sela EI, Pulungan R, Widyaningrum R, Shantiningsih RR. Method for automated selection of the trabecular area in digital periapical radiographic images using morphological operations. Healthcare Inform Res. (2019) 25:193–200. doi: 10.4258/hir.2019.25.3.193
32. Lezcano C, Noguera JLV, Pinto-Roa DP, García-Torres M, Gaona C, Gardel-Sotomayor E. P. A multi-objective approach for designing optimized operation sequence on binary image processing. Heliyon. (2020) 6:e03670. doi: 10.1016/j.heliyon.2020.e03670
33. Jamil N, Sembok TMT, Bakar AZ. “Noise removal and enhancement of binary images using morphological operations,” in 2008 International Symposium on Information Technology, Kuala Lumpur: IEEE (2008). doi: 10.1109/ITSIM.2008.4631954
34. Pepe MS. The Statistical Evaluation of Medical Tests for Classification and Prediction, Medicine (2003).
35. Cardoso JR, Pereira LM, Iversen MD, Ramos LA. “What is gold standard and what is ground truth?” Dental Press J Orthodontics. (2014) 19, 27–30. doi: 10.1590/2176-9451.19.5.027-030.ebo
36. Haddow JE, Palomaki GE, Khoury M. (2004). “ACCE: a model process for evaluating data on emerging genetic tests,” in Human Genome Epidemiology. 217–233.
37. Altman DG, Bland JM. Statistics notes: diagnostic tests 2: predictive values. BMJ. (1994) 309:102. doi: 10.1136/bmj.309.6947.102
38. Cohen J. A coefficient of agreement for nominal scales. Educ. Psychol. Measurement. (1960) 20:37–46. doi: 10.1177/001316446002000104
39. Tyndall DA, Ludlow JB, Platin E, Nair M. A comparison of Kodak Ektaspeed Plus film and the Siemens Sidexis digital imaging system for caries detection using receiver operating characteristic analysis. Oral Surg Oral Med Oral Pathol Oral Radiol Endodontol. (1998) 85:113–8. doi: 10.1016/S1079-2104(98)90408-5
40. Kuramoto T, Takarabe S, Okamura K, Shiotsuki K, Shibayama Y, Tsuru H, et al. Effect of differences in pixel size on image characteristics of digital intraoral radiographic systems: a physical and visual evaluation. Dentomaxillofacial Radiol. (2020) 49:20190378. doi: 10.1259/dmfr.20190378
41. Takarabe S, Kuramoto T, Shibayama Y, Tsuru H, Tatsumi M, Kato T, et al. Effect of beam quality and readout direction in the edge profile on the modulation transfer function of photostimulable phosphor systems via the edge method. J Med Imaging. (2021) 8:043501. doi: 10.1117/1.JMI.8.4.043501
42. Çalişkan A, Sumer AP. Definition, classification and retrospective analysis of photostimulable phosphor image artefacts and errors in intraoral dental radiography. Dentomaxillofacial Radiol. (2017) 46:20160188. doi: 10.1259/dmfr.20160188
43. Elangovan S, Mahabob MN, Jaishankar S, Kumar BS, Rajendran D. Faulty radiographs: a cross-sectional analysis among dental college students in Namakkal District, Tamil Nadu, India. J. Pharmacy Bioallied Sci. (2016) 8(Suppl 1):S116. doi: 10.4103/0975-7406.191938
44. Smith B, Arabandi S, Brochhausen M, Calhoun M, Ciccarese P, Doyle S, et al. Biomedical imaging ontologies: a survey and proposal for future work. J Pathol Informat. (2015) 6. doi: 10.4103/2153-3539.159214
45. Gurcan MN, Tomaszewski J, Overton JA, Doyle S, Ruttenberg A, Smith B. Developing the quantitative histopathology image ontology (QHIO): a case study using the hot spot detection problem. J Biomed Informat. (2017) 66:129–35. doi: 10.1016/j.jbi.2016.12.006
46. Krois J, Ekert T, Meinhold L, Golla T, Kharbot B, Wittemeier A, et al. Deep learning for the radiographic detection of periodontal bone loss. Sci. Rep. (2019) 9:2641. doi: 10.1038/s41598-019-44839-3
47. Kim J, Lee HS, Song IS, Jung KH. DeNTNet: deep neural transfer network for the detection of periodontal bone loss using panoramic dental radiographs. Sci. Rep. (2019) 9:20335. doi: 10.1038/s41598-019-53758-2
48. Chang HJ, Lee SJ, Yong TH, Shin NY, Jang BG, Kim JE, et al. Deep learning hybrid method to automatically diagnose periodontal bone loss and stage periodontitis. Sci. Rep. (2020) 10 7531. doi: 10.1038/s41598-020-64509-z
49. Kabir T, Lee CT, Nelson J, Sheng S, Meng HW, Chen L, et al. An end-to-end entangled segmentation and classification convolutional neural network for periodontitis stage grading from periapical radiographic images. arXiv preprint arXiv. (2021) 2109.13120. doi: 10.1109/BIBM52615.2021.9669422
50. Cha J-Y, Yoon H-I, Yeo I-S, Huh K-H, Han J-S. Peri-implant bone loss measurement using a region-based convolutional neural network on dental periapical radiographs. J Clin Med. (2021) 10:1009. doi: 10.3390/jcm10051009
51. Papapanou PN, Sanz M, Buduneli N, Dietrich T, Feres M, Fine DH, et al. Periodontitis: consensus report of workgroup 2 of the 2017 World Workshop on the Classification of Periodontal and Peri-Implant Diseases and Conditions. J. Periodontol. (2018) 89:S173–82. doi: 10.1002/JPER.17-0721
52. Ravidà A, Travan S, Saleh MH, Greenwell H, Papapanou PN, Sanz M, et al. Agreement among international periodontal experts using the 2017 World Workshop classification of periodontitis. J Periodontol. (2021) 92:1675–86. doi: 10.1002/JPER.20-0825
53. Yamashita R, Nishio M, Do RK. G., Togashi K. Convolutional neural networks: an overview and application in radiology. Insights Into Imaging. (2018) 9:611–29. doi: 10.1007/s13244-018-0639-9
Glossary
1. Computer aided diagnosis (CAD): A computer system that helps doctors to make quick decisions when analyzing medical images; 2. Grayscale: Converts a RGB channel into a single channel; 3. Classical Image Analysis: Processing an image through different intensity transformations, filters, and morphological operations; 4. Convolution: Operation between two functions that produces another third function that demonstrates how one function affects the other; 5. Filtering: An image processing technique to modify or enhance an image; 6. Gaussian High Pass Filter: A filtering method that blurs image and removes details and noise below a cut-off threshold; 7. Adaptive Histogram Equalization: An image processing technique that improves contrast in an image by splitting the image into multiple sections for development of a histogram for each section resulting in control of the local contrast for each section; 8. Contrast Limited Adaptive Histogram Equalization: An image processing technique that is a variant of adaptive histogram equalization. This technique limits the contrast amplification so that the noise would also be reduced; 9. Image Contrast Enhancement: Process to make portions of the image stand out more by adjusting the colors in the display; 10. Intensity Transformation: Mapping each pixel value of an input into an output value using a mathematical transformation; 11. Entropy: A measurement of the randomness in an image that could be used to define texture; 12. Binarization: Converting pixels of an image into either the foreground or background using some form of thresholding; 13. Morphological Processing: Broad set of image processing techniques that process images based on shapes; 14. Erosion: A morphological operation to remove pixels around an object boundary; 15. Dilation: A morphological operation to add pixels around an object boundary; 16. Closing: A combination of dilation and then erosion to close small holes in the foreground of the image; 17. Opening: A combination of erosion and dilation to remove noise from an image; 18. Segmentation: Separation of an image into multiple sections; 19. Thresholding: A Foundational segmentation method where each pixel value is compared against a value to determine if that pixel is in the foreground or background; 20. Histogram Thresholding: A simple thresholding technique to optimize classification of the histogram with a goal to segment an image in foreground and background; 21. Otsu Thresholding: Develops a thresholding value to separate the pixels into two classes by minimizing the intra-class variance; 22. Machine Learning (ML): A branch of AI which focuses on developing methods that can learn through experience and data to improve performance, without explicit direction; Support Vector Machines (SVM): Supervised learning models designed for data analysis by classification and regression. SVM constructs hyperplane(s) that causes most separation between classes, i.e., a hyperplane with largest distance to the nearest training data point in that class; 23. Naive Bayes (NB): A ML algorithm for classification problems by assuming that each feature is conditionally independent of one another; 24. Random Forest (RF): An ML algorithm that uses multiple decision trees for classification and regression. The final classification is done using majority voting, while in regression it averages all the decision trees together; 25. Artificial Neural Network (ANN): Systems consisting of many connected units called nodes, and each connection transmits information after some nonlinear transformation to another node; 26. Deep Learning (DL): Part of the Machine Learning family that uses multiple layers to extract and learn features from data. In some cases, it can exceed human performance; 27. Convolutional Neural Network (CNN): Class of Deep Learning models most used to analyze images; 28. Inception: A neural network that was introduced during the ImageNet Recognition Challenge ResNet: An ANN whose architecture allows it to skip over some layers to reduce training error; 29. End-to-End CNN: A single unified CNN architecture that takes an input and produces an output; 30. Transfer Learning: Applying the knowledge gained from solving one problem and applying to a related problem; 31. Dice Coefficient: A statistic used to determine how similar two samples are to each other; 32. Pixel Accuracy: The percent of pixels that are classified as the correct class; 33. F1 score: The harmonic mean between the precision and recall; 34. Jaccard Index: A statistic that measures the similarity between sample data sets; 35. Intraclass Correlation: A statistic that determines how objects in a group are related to one another; 36. Pearson's Correlation Coefficient: The linear correlation between two different datasets; 37. Mean absolute difference (MAD): A measure of the dataset spread which is equal to the absolute difference between two independent values; 38. Analysis of variance (ANOVA): A collection of statistical models and estimation procedures to determine the difference between different group means; 39. Cohen's kappa: A statistic that is used to measure agreement between observers for categorical values; 40. Logistic Regression (LR): An ML model used to model the probability of a certain event occurring, either yes/no; 41. p-value: The probability that an event will occur under the default hypothesis; 42. Chi-squared test: A test applied to contingency tables to assess statistical significance between row and column variables; 43. aximum likelihood estimation: A method to obtain parameter estimates based on maximizing the likelihood function.
Keywords: dental radiography, systems integration, periodontitis, peri-implantitis, artificial intelligence, machine learning
Citation: Sabharwal A, Kavthekar N, Miecznikowski J, Glogauer M, Maddi A and Sarder P (2022) Integrating Image Analysis and Dental Radiography for Periodontal and Peri-Implant Diagnosis. Front. Dent. Med. 3:840963. doi: 10.3389/fdmed.2022.840963
Received: 21 December 2021; Accepted: 07 March 2022;
Published: 30 March 2022.
Edited by:
Francisco Nociti, Universidade Estadual de Campinas, BrazilReviewed by:
Jacqueline W. Mays, National Institutes of Health (NIH), United StatesKumar Chandan Srivastava, Al Jouf University, Saudi Arabia
Copyright © 2022 Sabharwal, Kavthekar, Miecznikowski, Glogauer, Maddi and Sarder. This is an open-access article distributed under the terms of the Creative Commons Attribution License (CC BY). The use, distribution or reproduction in other forums is permitted, provided the original author(s) and the copyright owner(s) are credited and that the original publication in this journal is cited, in accordance with accepted academic practice. No use, distribution or reproduction is permitted which does not comply with these terms.
*Correspondence: Abhiram Maddi, maddi@musc.edu
†These authors have contributed equally to this work